
Thanks Andrew and others for all this good teaching, leading to understanding.
I'm wondering why you have the vertical scale of the charts set to Linear rather than Logarithmic, and still draw straight-line trend lines. A constant-growth-rate line on an Linear chart needs a parabolic line, doesn't it?
Your collaborator, Patrick Karim of Northstar and Badcharts, says "Linear charts work some of the time, Logarithmic charts work all the time" in this video:
I would love to see your comments on that, and on my comparison charts in this spreadsheet:: .
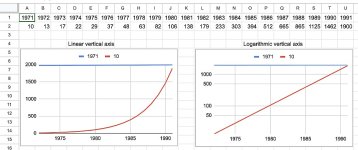
The screenshot shows the same data, a constant 30% p.a. rise, charted with Arithmetic and Logarithmic vertical scales.
Thanks for thinking about this,
Jim
I'm wondering why you have the vertical scale of the charts set to Linear rather than Logarithmic, and still draw straight-line trend lines. A constant-growth-rate line on an Linear chart needs a parabolic line, doesn't it?
Your collaborator, Patrick Karim of Northstar and Badcharts, says "Linear charts work some of the time, Logarithmic charts work all the time" in this video:
I would love to see your comments on that, and on my comparison charts in this spreadsheet:: .
The screenshot shows the same data, a constant 30% p.a. rise, charted with Arithmetic and Logarithmic vertical scales.
Thanks for thinking about this,
Jim